Fire Spread feature updates: new clarity for wildfire response
When wildfires move fast, response decisions have to move faster. With the recent updates to our Fire Spread tool, we’re introducing vital new layers of visual intelligence that empower firefighters and emergency teams to see, interpret, and act on wildfire behavior in real-time, more precisely than ever before.
Whether you're managing suppression strategies or anticipating fire spread hours ahead, this update brings mission-critical data forward in a format designed for speed, clarity, and direct action.
Fireline Intensity: thermal energy, predicted and visualized
Understanding how much energy a wildfire is releasing is key to predicting how it spreads and planning how to respond, but other systems struggle on how to measure and display it quickly. Our Fire Spread tool now calculates and shows fireline intensity natively within simulations.
The output is classified into "intensity bands"- with darker colors indicating more intense energy release. These satellite observations are compared to the surrounding area, with the resulting energy detection between individual pixels.
These simulations are important for burn predictions, allowing firefighting teams to anticipate the behavior of the fireline and plan accordingly. Higher intensity areas signal faster spread, more aggressive behavior, and greater risk.
Knowing where the most energy is being released helps you decide where and how to intervene, before it even happens.
Flame Length: a visual cue for suppression strategy
Flame length is one of the most immediate indicators of how dangerous a fire is for ground crews. Until now, it was something only measured by direct observation. Our Fire Spread tool now predicts the flame length up to 24 hours ahead, helping to determine suppression strategy while responding to a fire - valuable knowledge before boots hit the ground.
By estimating flame length from fireline intensity, each pixel in the simulation reflects the vertical height of flames, from "Very Low" (<0.6m) to "Critical" (15m+). A color-coded overlay shows the severity across the map, and hovering reveals class data per pixel.
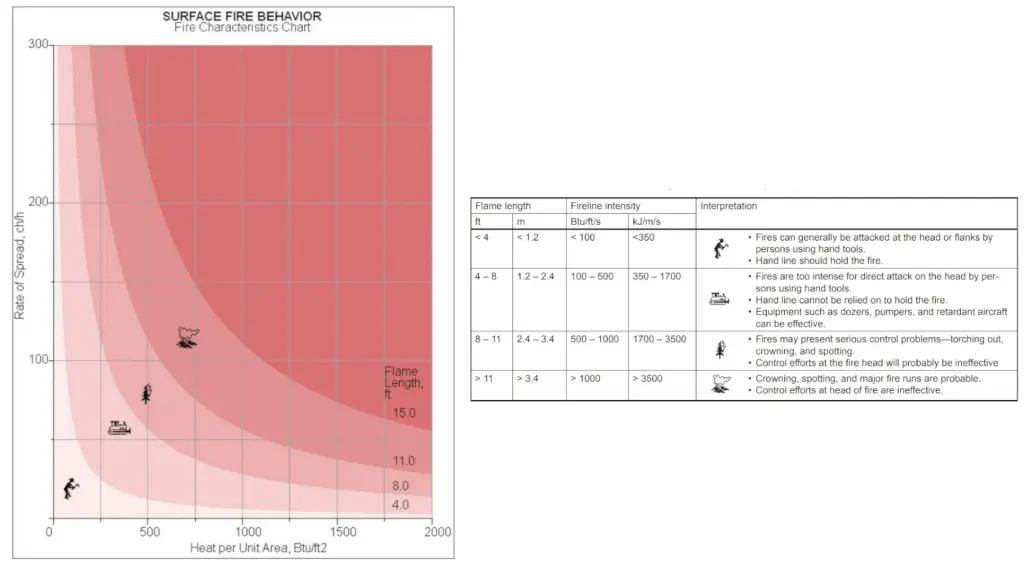
This output aligns with US Forest Service guidelines, making it easy to apply in the field or incident command. As seen above, the preferred response strategy is largely determined by both flame length and fireline intensity, now living natively in our simulation. These two metrics give a rapid, intuitive understanding of whether direct suppression is possible or too dangerous to attempt.
Rate of Spread & Head Rate of Spread: Precision in Motion
Wildfires don’t move uniformly. Slope, wind, and fuel type all affect how quickly different parts of the fire advance. While our Fire Spread simulations have always calculated this in the background, we now visualize this variability pixel-by-pixel directly on the map
The new rate-of-spread layer shows how fast each part of the fire is moving relative to its location, helping local teams see how their sector is behaving compared to the whole. On large-scale fires, this is critical for understanding risk in your exact area. The head of the fire could be stalled due to terrain or fuel, while the flanks burn faster because of wind variability - this can all be displayed in the Fire Spread tool.
Speaking of the head of the fire, a new chart shows Head Rate of Spread (HROS), summarizing how quickly the main fire front is advancing. It’s a clear, single metric that provides situational awareness for any role on the response team.
Turning Data into Decisions
Our new Fire Spread features are about delivering clarity in the moments that matter most. In wildfire response, time is compressed, and uncertainty is high. Decisions need to be made fast, and they need to be right.
That’s why this release focuses not only on what data is available, but how it's presented. It brings critical variables, like fire intensity, flame length, and rate of spread, out of the backend and into the operational interface, making them immediately accessible, visual, and actionable. We plan on rolling more of these features in the future: next, we plan on calculating the Fireline Intensity directly from the satellite observations. More to come on that soon!
For frontline crews, this means knowing whether it’s safe to engage a fire or if it’s time to establish new containment lines. For incident commanders, it means seeing the shape and behavior of the fire evolve in real-time, not just as a boundary line, but as a dynamic system with intensity, velocity, and risk. And for analysts or coordinators supporting from afar, it creates a shared operational picture that improves coordination and confidence.
Because in a wildfire emergency, seeing clearly is acting decisively.
Read more stories about OroraTech